

GMP clearance Sponsor Information Dashboard (SID)
SID provides industry with regular updates about the backlog reduction, actual processing times, existing workloads, requesting prioritisation and other key messages for GMP clearance applications.
The below data is from 1 September 2026 and will be updated every 4 to 6 weeks to ensure it remains current.
We welcome any feedback you may have on the SID. Please send this to GMPclearance@health.gov.au.
Backlog reduction progress
The graphs below illustrate the trend of GMP Clearance applications over time. Further details on actual numbers can be read by opening the drop-down menu under each graph.
Figure 1 shows the trend of the total number of CV applications in our lodgement queue over the past 12 months. Since the end of Q3 2025, the total number of applications reduced from 1853 applications to 904, a reduction of approximately 51%.
Figure 1 - Total number of CV applications pending assessment between Q3 2025 and Q3 2026
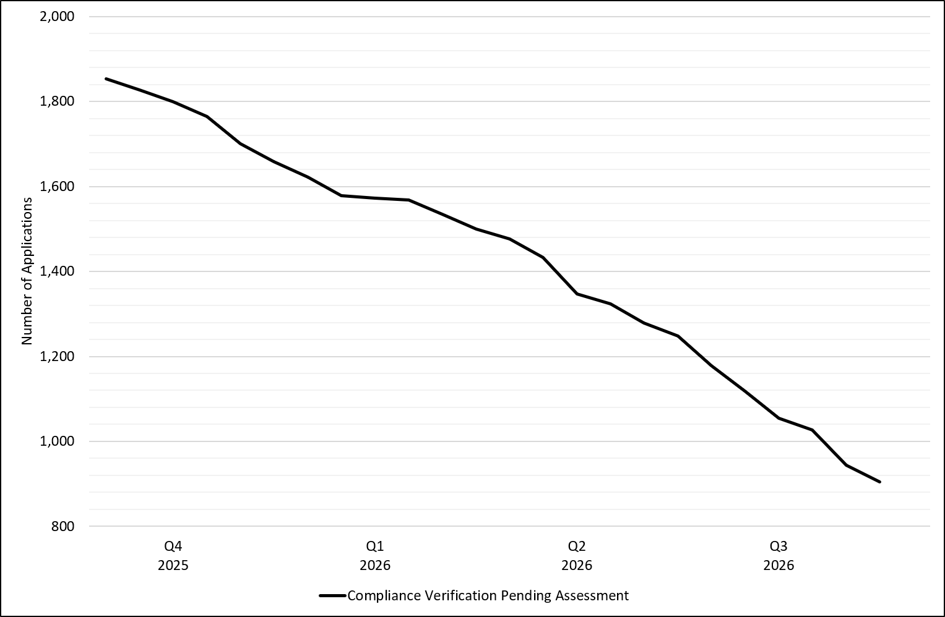

Figure 1 shows a line graph detailing the total number of Good Manufacturing Practice (GMP) Compliance Verification (CV) clearance applications between Q3 2025 and Q3 2026.
The vertical axis represents the total number of GMP clearance applications within the TGA’s application lodgement system.
The horizontal axis represents the date broken down by quarter and year.
The graph starts at 1853 applications in Q3 2025 and ends at 904 applications in Q3 2026, illustrating a steady decrease in the backlog over 12 months.
Figure 2 shows the trend of applications in our CV streams over the past year with each line representing a different stream.
Both the Non-Sterile Active Pharmaceutical Ingredient (NS-API) and Non-Sterile Finished Product (NS-FP) streams have significantly reduced during this time. From Q1 2026, the rate of reduction in the non-sterile streams increased coinciding with GMP evaluators completing training. There is now also a consistent reduction in the Sterile Finished Product (ST-FP) stream whilst there has also been a modest downward trend in the Sterile API stream (S-API).
Figure 2 - number of CV applications in lodgement by stream between Q3 2025 and Q3 2026
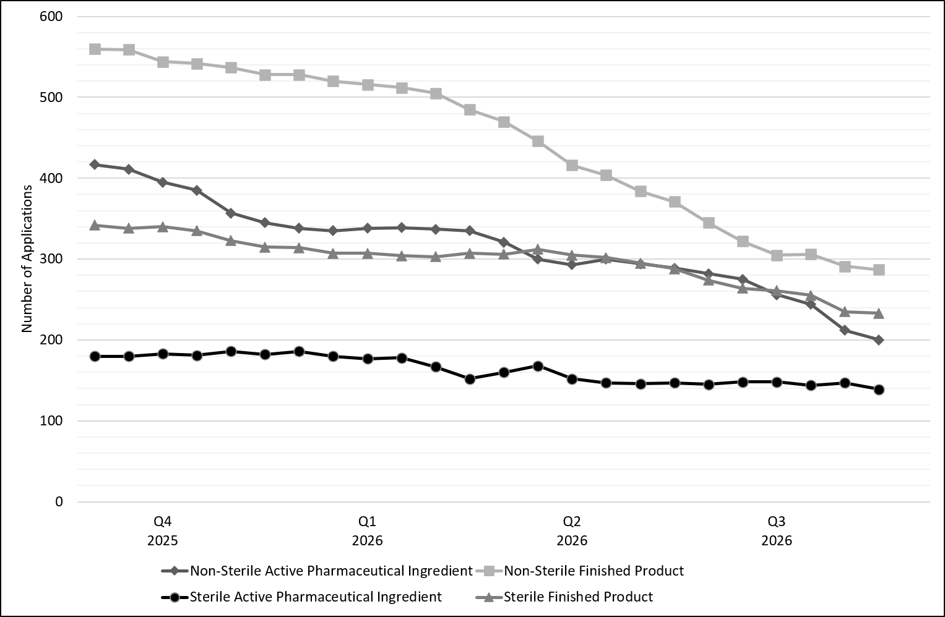

Figure 2 shows a line graph detailing the number of Good Manufacturing Practice (GMP) clearance compliance verification applications pending assessment in each stream between Q3 2025 and Q3 2026.
The vertical axis represents the total number of GMP compliance verification clearance applications within the TGA’s application lodgement system.
The horizontal axis represents the date broken down by quarter and year.
There are four lines represented within the graph.
The line with a square marker at the top of the graph represents non-sterile finished product compliance verification applications. The line shows a consistent decrease in application numbers from ~560 in Q3 2025 to ~287 by 1 September 2026.
The next line with a diamond marker represents non-sterile active pharmaceutical ingredient compliance verification applications. This shows a decrease in application numbers from ~417 in Q3 2025 to ~200 by 1 September 2026.
The third line with a triangle marker represents sterile finished product compliance verification applications. This shows that there was a decrease in application numbers from ~342 to ~233 by 1 September 2026.
The bottom line with a circle marker represents sterile active pharmaceutical ingredient compliance verification applications. This shows that there has been a slight decrease from ~180 to ~139 by 1 September 2026.
Workload volumes
Figure 3 shows a snapshot of all GMP Clearance applications in the system at different stages of evaluation or queue categories. The largest number remains 'complete' applications in lodgement queues ready for evaluation (This includes both MRA and CV application types). The total number of all applications in the system on 1 September 2026 was 1987. This is a total reduction of 214 since the July update.
Figure 3 - total number of GMP clearance applications and the applications status as of 1 September 2026
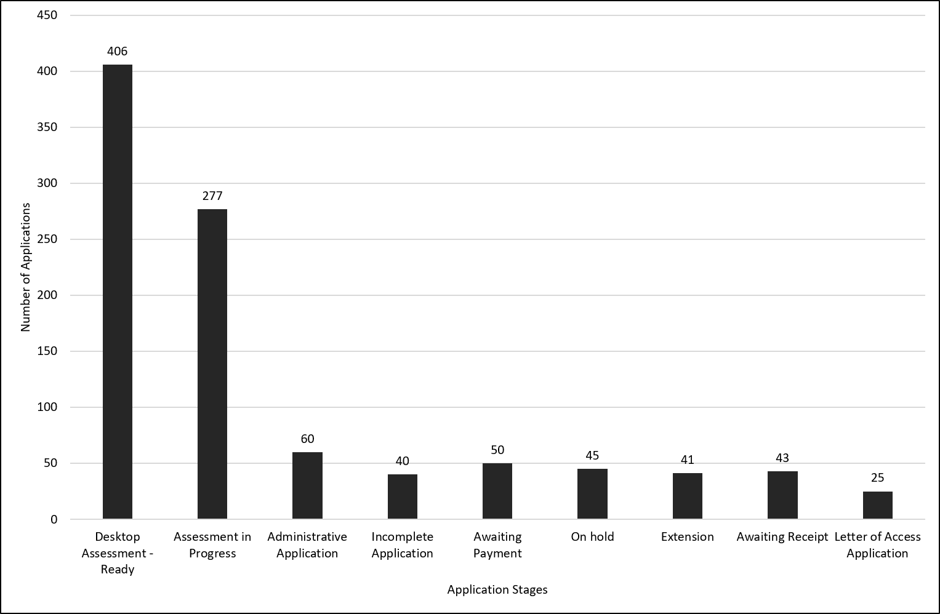

Figure 3 shows a bar graph detailing total numbers of Good Manufacturing Practice (GMP) clearance applications and the applications status.
The vertical axis represents the number of applications.
The horizontal axis represents the status of the applications.
There are nine bars:
The first bar from the left side of the graph represents complete applications awaiting assessment, there are 406 applications represented, a decrease of 163 applications since July.
The second bar represents assessments in progress, that is applications currently being considered by evaluators, there are 277 applications represented, an increase of 37 applications since July.
The third bar represents administrative applications awaiting assessment, this includes updates for manufacturer names and addresses as well as other application types, there are 60 applications represented, a decrease by 25 applications since July.
The fourth bar represents incomplete applications, there are 40 applications represented, a decrease of 8 applications since July.
The fifth bar represents applications awaiting payment, there are 50 applications represented, a decrease of 19 applications since July.
The sixth bar represents applications which are currently on hold (typically for GMP non-compliance investigations), there are 45 applications represented, a decrease of 11 since July.
The seventh bar represents extension applications. There are 41 applications represented, an increase of 11 applications since July.
The eighth bar represents awaiting receipt applications, there are 43 applications represented, a decrease of 16 applications since July.
The ninth bar on the far right of the graph represents letter of access applications. There are 25 applications represented, a decrease of 20 applications since July.
CV processing timeframes (Rolling 2-year data)
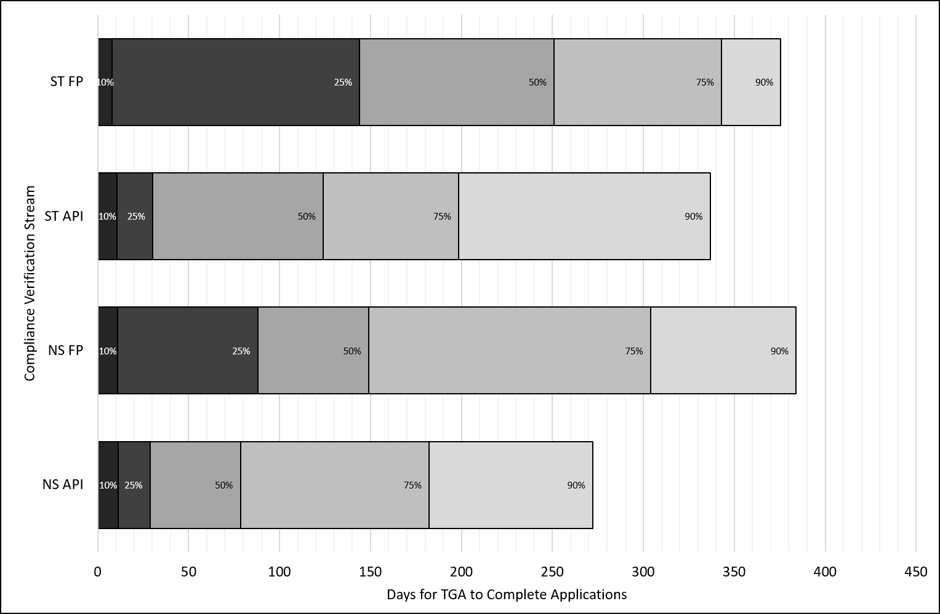
Figure 4 shows the percentile ranges for application processing timeframes for applications submitted in the last two years for each CV stream, measured in TGA working days.
Each bar is divided into percentiles, which represent the percentage of applications completed within a certain number of days. For example, the 50th percentile means half of the applications were completed in that time or less. The percentiles build on each other - for example, the 50% mark includes all applications completed within the 10% and 25% ranges as well.
It is expected these percentiles will fluctuate as we return to a steady state and continue to manage requests for prioritisation.
Figure 4 - percentage of CV applications submitted and completed within the past two years as of 1 September 2026
ST FP: sterile finished product applications
ST API: sterile active pharmaceutical ingredient applications
NS FP: non-sterile finished product applications
NS API: non-sterile active pharmaceutical ingredient applications

Figure 4 shows a bar graph detailing percentages of Good Manufacturing Practice (GMP) clearance compliance verification applications completed within specified TGA working days during the past two years.
The vertical axis represents the compliance verification application streams.
The horizontal axis represents the number of days taken by the TGA to complete applications.
There are four bars, the first bar from the bottom of the graph represents non-sterile active pharmaceutical ingredient compliance verification applications. This shows that:
- ten percent of applications are completed within 11 days,
- twenty five percent of applications are completed within 29 days,
- fifty percent of applications are completed within 79 days,
- seventy five percent of applications are completed within 182 days
- ninety percent of applications are completed within 272 days.
The second bar represents non-sterile finished product compliance verification applications. This shows that:
- ten percent of applications are completed within 11 days
- twenty five percent of applications are completed within 88 days
- fifty percent of applications are completed within 149 days
- seventy five percent of applications are completed within 304 days
- ninety percent of applications are completed within 384 days
The third bar represents sterile active pharmaceutical ingredient compliance verification applications. This shows that:
- ten percent of applications are completed within 11 days
- twenty five percent of applications are completed within 30 days
- fifty percent of applications are completed within 124 days
- seventy five percent of applications are completed within 199 days
- ninety percent of applications are completed within 337 days
The fourth bar represents sterile finished product compliance verification applications. This shows that:
- ten percent of applications are completed within 8 days
- twenty five percent of applications are completed within 144 days
- fifty percent of applications are completed within 251 days
- seventy five percent of applications are completed within 343 days
- ninety percent of applications are completed within 376 days
MRA processing timeframes (rolling 3 monthly data)
The figures below provide an overview of the target and actual processing times for MRA applications, measured in TGA working days. The actual processing time applies for 90 percent of applications completed within the last 3 months.
-
30
Target MRA application processing time
-
25
Actual MRA application processing time
CV application annual volumes
Figure 5 shows a snapshot of GMP Clearance CV applications received and completed within the last four years since 2023. Overall, there is a general decline in applications received over time. In 2025, we completed 1704 CV applications, which is 57% more than received that year as we implemented the backlog reduction strategy and had more evaluators complete training on CV applications.
As of 1 September 2026, the number of applications completed continue to exceed those received, with 1223 applications completed year to date, which is approximately 69% more than the number of applications received.
Figure 5 - total number of GMP clearance CV applications received and completed per year as of 1 July 2026
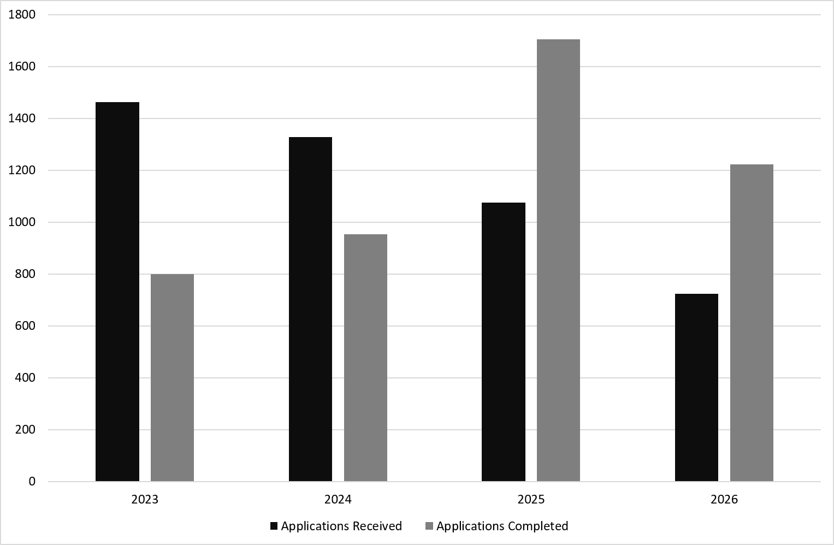

Figure 5 shows a clustered column bar graph comparing the number of Good Manufacturing Practice (GMP) clearance compliance verification applications received and completed across four years (2023-2026).
The vertical axis represents the number of applications.
The horizontal axis represents the calendar year.
There are four pairs of bars, with each pair representing a single year. Within each pair:
- the black bar represents applications received, and
- the grey bar represents applications completed.
The first pair of bars (2023) shows that:
- approximately 1,450 applications were received, and
- approximately 800 applications were completed.
The second pair of bars (2024) shows that:
- approximately 1,350 applications were received, and
- approximately 950 applications were completed.
The third pair of bars (2025) shows that:
- approximately 1,100 applications were received, and
- approximately 1,700 applications were completed.
The fourth pair of bars (2026) shows that:
- approximately 724 applications were received, and
- approximately 1,223 applications were completed.
Overall, the graph shows a decreasing trend in applications received over time, while applications completed increase significantly in 2025 with the implementation of backlog reduction strategies.
Application Quality (rolling 6-monthly data)
The figures below provide an overview of how many applications required a Request For Information (RFI) or were incomplete at the time of submission.
-
11 % of 399 applications
Percentage of Mutual Recognition Agreement (MRA) applications requiring an RFI
-
30 % of 969 applications
Percentage of incomplete CV applications
-
65 % of 969 applications
Percentage of Compliance Verification (CV) applications requiring an RFI
-
26 % of 54 applications
Percentage of TGA certificate applications requiring an RFI
-
48 % of 67 applications
Percentage of applications using a letter of access (LoA) requiring an RFI
The above data tells us that approximately 1 in every 3 CV applications is submitted incomplete. This adds pressure to TGA staff and causes significant delays in processing times. We encourage sponsors to work with their manufacturers to ensure all required evidence is provided at the point of submission where possible.
Prioritisation requests
We will continue to process effective applications as quickly as possible. Medicine shortages remain a high priority for us, and we will continue to process these when sponsors have provided the required information.
Please note that we will liaise internally with the medicine shortages team to verify requests and seek additional information such as supply and market data.
For any request for prioritisation, you must provide the required information outlined below via email:
- The product name and existing ARTG number (where applicable)
- The category of medicine (Complementary, Non-prescription, Prescription etc.)
- The product submission type and submission number and any applicable milestone dates (for example, priority review pathway or NCE, PM-XXXX-XXXXX-X-X etc.)
- For variations, you need to provide information about the change as certain changes made by manufacturers may require additional GMP evaluation.
- For requests linked to reportable medicines, the medicines shortage notification number (for example MS-XXXX-XX-XXXXX-X)
- Any other information to help us understand the urgency of the situation. For example, existing stock levels or run-out dates, negative effect on patients or business etc.